10.8. Network Diagnosis Tools
When a network application does not run as expected, it is important to be able to look under the hood. Even when everything seems to run smoothly, running a network diagnosis can help ensure everything is working as it should. Several diagnosis tools exists for this purpose; each one operates on a different level.
10.8.1. Local Diagnosis: netstat
Let's first mention the netstat command (in the net-tools package); it displays an instant summary of a machine's network activity. When invoked with no argument, this command lists all open connections; this list can be very verbose since it includes many Unix-domain sockets (widely used by daemons) which do not involve the network at all (for example, dbus communication, X11 traffic, and communications between virtual filesystems and the desktop).
Common invocations therefore use options that alter netstat's behavior. The most frequently used options include:
-t, which filters the results to only include TCP connections;
-u, which works similarly for UDP connections; these options are not mutually exclusive, and one of them is enough to stop displaying Unix-domain connections;
-a, to also list listening sockets (waiting for incoming connections);
-n, to display the results numerically: IP addresses (no DNS resolution), port numbers (no aliases as defined in /etc/services) and user ids (no login names);
-p, to list the processes involved; this option is only useful when netstat is run as root, since normal users will only see their own processes;
-c, to continuously refresh the list of connections.
Other options, documented in the netstat(8) manual page, provide an even finer control over the displayed results. In practice, the first five options are so often used together that systems and network administrators practically acquired netstat -tupan as a reflex. Typical results, on a lightly loaded machine, may look like the following:
# netstat -tupan
Active Internet connections (servers and established)
Proto Recv-Q Send-Q Local Address           Foreign Address         State       PID/Program name
tcp        0      0 0.0.0.0:22              0.0.0.0:*               LISTEN      2224/sshd
tcp        0      0 127.0.0.1:25            0.0.0.0:*               LISTEN      994/exim4
tcp        0      0 192.168.1.241:22        192.168.1.128:47372     ESTABLISHED 2944/sshd: roland [
tcp        0      0 192.168.1.241:22        192.168.1.128:32970     ESTABLISHED 2232/sshd: roland [
tcp6       0      0 :::22                   :::*                    LISTEN      2224/sshd
tcp6       0      0 ::1:25                  :::*                    LISTEN      994/exim4
udp        0      0 0.0.0.0:68              0.0.0.0:*                           633/dhclient
udp        0      0 192.168.1.241:123       0.0.0.0:*                           764/ntpd
udp        0      0 127.0.0.1:123           0.0.0.0:*                           764/ntpd
udp        0      0 0.0.0.0:123             0.0.0.0:*                           764/ntpd
udp6       0      0 fe80::a00:27ff:fe6c:123 :::*                                764/ntpd
udp6       0      0 2002:52e0:87e4:0:a0:123 :::*                                764/ntpd
udp6       0      0 ::1:123                 :::*                                764/ntpd
udp6       0      0 :::123                  :::*                                764/ntpd
As expected, this lists established connections, two SSH connections in this case, and applications waiting for incoming connections (listed as LISTEN), notably the Exim4 email server listening on port 25.
10.8.2. Remote Diagnosis: nmap
nmap (in the similarly-named package) is, in a way, the remote equivalent for netstat. It can scan a set of “well-known” ports for one or several remote servers, and list the ports where an application is found to answer to incoming connections. Furthermore, nmap is able to identify some of these applications, sometimes even their version number. The counterpart of this tool is that, since it runs remotely, it cannot provide information on processes or users; however, it can operate on several targets at once.
A typical nmap invocation only uses the -A option (so that nmap attempts to identify the versions of the server software it finds) followed by one or more IP addresses or DNS names of machines to scan. Again, many more options exist to finely control the behavior of nmap; please refer to the documentation in the nmap(1) manual page.
# nmap scouzmir

Starting Nmap 5.00 ( http://nmap.org ) at 2010-10-12 18:52 CEST
Interesting ports on 192.168.1.101:
Not shown: 998 closed ports
PORT    STATE SERVICE
22/tcp  open  ssh
111/tcp open  rpcbind
MAC Address: 52:54:00:99:01:01 (QEMU Virtual NIC)

Nmap done: 1 IP address (1 host up) scanned in 2.11 seconds
# nmap -A localhost

Starting Nmap 5.00 ( http://nmap.org ) at 2010-10-12 18:59 CEST
Warning: Hostname localhost resolves to 2 IPs. Using 127.0.0.1.
Interesting ports on localhost (127.0.0.1):
Not shown: 997 closed ports
PORT    STATE SERVICE VERSION
22/tcp  open  ssh     OpenSSH 5.5p1 Debian 4 (protocol 2.0)
|  ssh-hostkey: 1024 af:07:60:17:16:64:6f:ee:c4:ca:b5:64:1e:4a:4c:22 (DSA)
|_ 2048 25:b0:aa:6b:11:5a:56:b6:8d:2d:ed:b3:16:17:96:33 (RSA)
25/tcp  open  smtp    Exim smtpd 4.72
|  smtp-commands: EHLO scouzmir.internal.placard.fr.eu.org Hello localhost [127.0.0.1], SIZE 52428800, PIPELINING, HELP
|_ HELP Commands supported: AUTH HELO EHLO MAIL RCPT DATA NOOP QUIT RSET HELP
111/tcp open  rpcbind
|  rpcinfo:
|  100000  2    111/udp  rpcbind
|  100024  1  53273/udp  status
|  100000  2    111/tcp  rpcbind
|_ 100024  1  41127/tcp  status
No exact OS matches for host (If you know what OS is running on it, see http://nmap.org/submit/ ).
TCP/IP fingerprint:
OS:SCAN(V=5.00%D=10/12%OT=22%CT=1%CU=34421%PV=N%DS=0%G=Y%TM=4CB4941A%P=i686
OS:-pc-linux-gnu)SEQ(SP=BF%GCD=1%ISR=CC%TI=Z%CI=Z%II=I%TS=8)OPS(O1=M400CST1
OS:1NW4%O2=M400CST11NW4%O3=M400CNNT11NW4%O4=M400CST11NW4%O5=M400CST11NW4%O6
OS:=M400CST11)WIN(W1=8000%W2=8000%W3=8000%W4=8000%W5=8000%W6=8000)ECN(R=Y%D
OS:F=Y%T=40%W=8018%O=M400CNNSNW4%CC=Y%Q=)T1(R=Y%DF=Y%T=40%S=O%A=S+%F=AS%RD=
OS:0%Q=)T2(R=N)T3(R=Y%DF=Y%T=40%W=8000%S=O%A=S+%F=AS%O=M400CST11NW4%RD=0%Q=
OS:)T4(R=Y%DF=Y%T=40%W=0%S=A%A=Z%F=R%O=%RD=0%Q=)T5(R=Y%DF=Y%T=40%W=0%S=Z%A=
OS:S+%F=AR%O=%RD=0%Q=)T6(R=Y%DF=Y%T=40%W=0%S=A%A=Z%F=R%O=%RD=0%Q=)T7(R=Y%DF
OS:=Y%T=40%W=0%S=Z%A=S+%F=AR%O=%RD=0%Q=)U1(R=Y%DF=N%T=40%IPL=164%UN=0%RIPL=
OS:G%RID=G%RIPCK=G%RUCK=G%RUD=G)IE(R=Y%DFI=N%T=40%CD=S)

Network Distance: 0 hops
Service Info: Host: scouzmir.internal.placard.fr.eu.org; OS: Linux

OS and Service detection performed. Please report any incorrect results at http://nmap.org/submit/ .
Nmap done: 1 IP address (1 host up) scanned in 21.32 seconds
As expected, the SSH and Exim4 applications are listed. Note that not all applications listen on all IP addresses; since Exim4 is only accessible on the lo loopback interface, it only appears during an analysis of localhost and not when scanning scouzmir (which maps to the eth0 interface on the same machine).
10.8.3. Sniffers: tcpdump and wireshark
Sometimes, one needs to look at what actually goes on the wire, packet by packet. These cases call for a “frame analyzer”, more widely known as a sniffer. Such a tool observes all the packets that reach a given network interface, and displays them in a user-friendly way.
The venerable tool in this domain is tcpdump, available as a standard tool on a wide range of platforms. It allows many kinds of network traffic capture, but the representation of this traffic stays rather obscure. We will therefore not describe it in further detail.
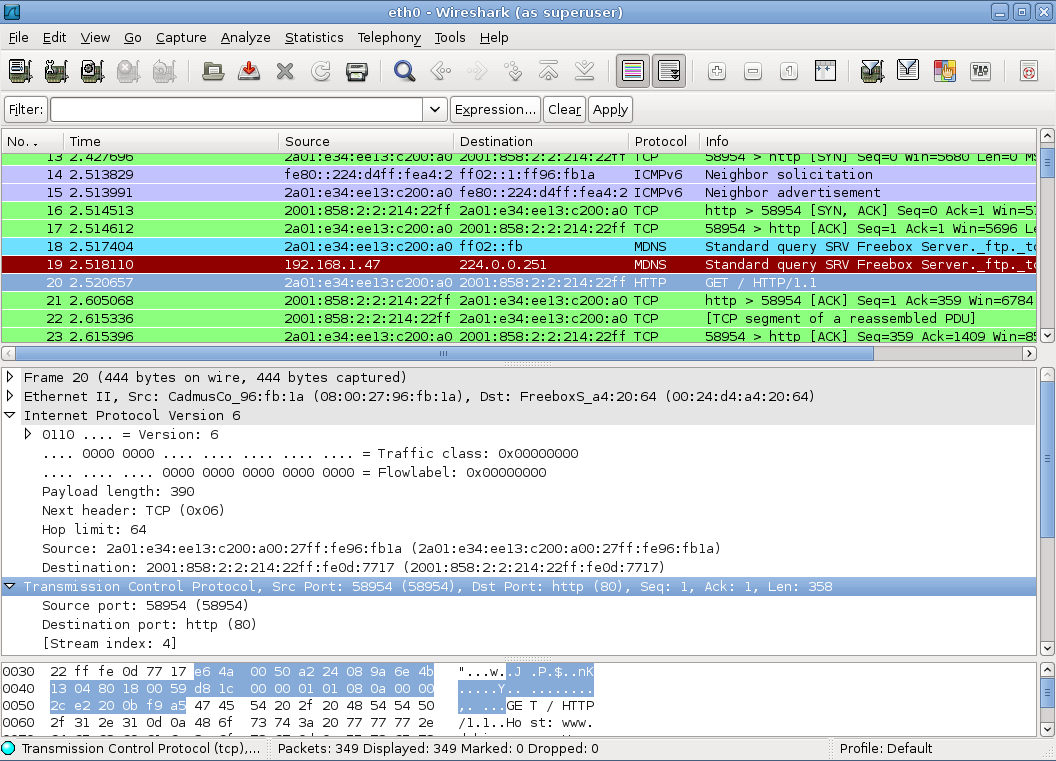
A more recent (and more modern) tool, wireshark (in the wireshark package), is slowly becoming the new reference in network traffic analysis due to its many decoding modules that allow for a simplified analysis of the captured packets. The packets are displayed graphically with an organization based on the protocol layers. This allows a user to visualize all protocols involved in a packet. For example, given a packet containing an HTTP request, wireshark displays, separately, the information concerning the physical layer, the Ethernet layer, the IP packet information, the TCP connection parameters, and finally the HTTP request itself.
In our example, the packets traveling over SSH are filtered out (with the !tcp.port == 22 filter). The packet currently displayed was developed at the TCP and HTTP layers.