When a network application does not run as expected, it is important to be able to look under the hood. Even when everything seems to run smoothly, running a network diagnosis can help ensure everything is working as it should. Several diagnosis tools exists for this purpose; each one operates on a different level. It would go beyond the scope of this book to discuss all tools, so we will focus on the more well-known and commonly used tools in the following sections.
首先是在 net-tools 包中的 netstat 命令;这个命令能够显示机器的实时网络活动。当直接运行时,该程序会输出所有的连接;由于该命令会输出很多不涉及网络的 Unix 域套接字(如 dbus 连接、X11 连接,以及虚拟文件系统和桌面间的通信),所以输出内容会非常长。
因此,运行 netstat 命令时通常会使用其他命令行参数。最常用的参数都有:
-t, 会只输出 TCP 连接;
-u, which works similarly for UDP connections; these options are not mutually exclusive, and one of them is enough to stop displaying Unix-domain connections;
-a, to also list listening sockets (waiting for incoming connections);
-n, to display the results numerically: IP addresses (no DNS resolution), port numbers (no aliases as defined in /etc/services) and user ids (no login names);
-p, 列出所涉及的进程;由于普通用户只能看到自己的进程,这个选项仅在 netstat 以 root 身份运行时才有效;
-c, 不断刷新连接列表。
Other options, documented in the netstat(8) manual page, provide an even finer control over the displayed results. In practice, the first five options are so often used together that systems and network administrators practically acquired netstat -tupan as a reflex. Typical results, on a lightly loaded machine, may look like the following:
# netstat -tupan
Active Internet connections (servers and established)
Proto Recv-Q Send-Q Local Address           Foreign Address         State       PID/Program name
tcp        0      0 0.0.0.0:111             0.0.0.0:*               LISTEN      397/rpcbind
tcp        0      0 0.0.0.0:22              0.0.0.0:*               LISTEN      431/sshd
tcp        0      0 0.0.0.0:36568           0.0.0.0:*               LISTEN      407/rpc.statd
tcp        0      0 127.0.0.1:25            0.0.0.0:*               LISTEN      762/exim4
tcp        0    272 192.168.1.242:22        192.168.1.129:44452     ESTABLISHED 1172/sshd: roland [
tcp6       0      0 :::111                  :::*                    LISTEN      397/rpcbind
tcp6       0      0 :::22                   :::*                    LISTEN      431/sshd
tcp6       0      0 ::1:25                  :::*                    LISTEN      762/exim4
tcp6       0      0 :::35210                :::*                    LISTEN      407/rpc.statd
udp        0      0 0.0.0.0:39376           0.0.0.0:*                           916/dhclient
udp        0      0 0.0.0.0:996             0.0.0.0:*                           397/rpcbind
udp        0      0 127.0.0.1:1007          0.0.0.0:*                           407/rpc.statd
udp        0      0 0.0.0.0:68              0.0.0.0:*                           916/dhclient
udp        0      0 0.0.0.0:48720           0.0.0.0:*                           451/avahi-daemon: r
udp        0      0 0.0.0.0:111             0.0.0.0:*                           397/rpcbind
udp        0      0 192.168.1.242:123       0.0.0.0:*                           539/ntpd
udp        0      0 127.0.0.1:123           0.0.0.0:*                           539/ntpd
udp        0      0 0.0.0.0:123             0.0.0.0:*                           539/ntpd
udp        0      0 0.0.0.0:5353            0.0.0.0:*                           451/avahi-daemon: r
udp        0      0 0.0.0.0:39172           0.0.0.0:*                           407/rpc.statd
udp6       0      0 :::996                  :::*                                397/rpcbind
udp6       0      0 :::34277                :::*                                407/rpc.statd
udp6       0      0 :::54852                :::*                                916/dhclient
udp6       0      0 :::111                  :::*                                397/rpcbind
udp6       0      0 :::38007                :::*                                451/avahi-daemon: r
udp6       0      0 fe80::5054:ff:fe99::123 :::*                                539/ntpd
udp6       0      0 2001:bc8:3a7e:210:a:123 :::*                                539/ntpd
udp6       0      0 2001:bc8:3a7e:210:5:123 :::*                                539/ntpd
udp6       0      0 ::1:123                 :::*                                539/ntpd
udp6       0      0 :::123                  :::*                                539/ntpd
udp6       0      0 :::5353                 :::*                                451/avahi-daemon: r
As expected, this lists established connections, two SSH connections in this case, and applications waiting for incoming connections (listed as LISTEN), notably the Exim4 email server listening on port 25.
10.9.2. Remote Diagnosis: nmap
nmap (in the similarly-named package) is, in a way, the remote equivalent for netstat. It can scan a set of “well-known” ports for one or several remote servers, and list the ports where an application is found to answer to incoming connections. Furthermore, nmap is able to identify some of these applications, sometimes even their version number. The counterpart of this tool is that, since it runs remotely, it cannot provide information on processes or users; however, it can operate on several targets at once.
A typical nmap invocation only uses the -A option (so that nmap attempts to identify the versions of the server software it finds) followed by one or more IP addresses or DNS names of machines to scan. Again, many more options exist to finely control the behavior of nmap; please refer to the documentation in the nmap(1) manual page.
# nmap debian
Starting Nmap 7.80 ( https://nmap.org ) at 2022-02-22 20:58 CET
Nmap scan report for debian (192.168.122.57)
Host is up (0.000087s latency).
Not shown: 996 closed ports
PORT    STATE SERVICE
22/tcp  open  ssh
79/tcp  open  finger
80/tcp  open  http
113/tcp open  ident

Nmap done: 1 IP address (1 host up) scanned in 0.07 seconds
# nmap -A localhost
nmap -A localhost
Starting Nmap 7.80 ( https://nmap.org ) at 2022-02-22 20:56 CET
Stats: 0:01:16 elapsed; 0 hosts completed (1 up), 1 undergoing Service Scan
Service scan Timing: About 83.33% done; ETC: 20:57 (0:00:15 remaining)
Nmap scan report for localhost (127.0.0.1)
Host is up (0.000086s latency).
Other addresses for localhost (not scanned): ::1
Not shown: 994 closed ports
PORT    STATE SERVICE VERSION
22/tcp  open  ssh     OpenSSH 8.4p1 Debian 5 (protocol 2.0)
|_auth-owners: foobar
25/tcp  open  smtp    Postfix smtpd
|_auth-owners: foobar
|_smtp-commands: debian, PIPELINING, SIZE 10240000, VRFY, ETRN, STARTTLS, ENHANCEDSTATUSCODES, 8BITMIME, DSN, SMTPUTF8, CHUNKING,
| ssl-cert: Subject: commonName=debian
| Subject Alternative Name: DNS:debian
| Not valid before: 2022-02-22T14:48:42
|_Not valid after:  2032-02-20T14:48:42
|_ssl-date: TLS randomness does not represent time
79/tcp  open  finger?
|_auth-owners: foobar
|_finger: ERROR: Script execution failed (use -d to debug)
80/tcp  open  http    Apache httpd 2.4.52 ((Debian))
|_auth-owners: foobar
|_http-server-header: Apache/2.4.52 (Debian)
|_http-title: Apache2 Debian Default Page: It works
113/tcp open  ident   Liedentd (Claimed user: foobar)
|_auth-owners: foobar
631/tcp open  ipp     CUPS 2.3
|_auth-owners: foobar
| http-robots.txt: 1 disallowed entry
|_/
|_http-server-header: CUPS/2.3 IPP/2.1
|_http-title: Home - CUPS 2.3.3op2
Service Info: Host:  debian; OS: Linux; CPE: cpe:/o:linux:linux_kernel

Service detection performed. Please report any incorrect results at https://nmap.org/submit/ .
Nmap done: 1 IP address (1 host up) scanned in 87.91 seconds
As expected, e.g. the SSH, Apache and Postfix applications are listed. Note that not all applications listen on all IP addresses; since Postfix is only accessible on the lo loopback interface, it only appears during an analysis of localhost and not when scanning debian (which maps to the enp1s0 interface on the same machine).
10.9.3. Sniffers: tcpdump and wireshark
Sometimes, one needs to look at what actually goes on the wire, packet by packet. These cases call for a “frame analyzer”, more widely known as a sniffer. Such a tool observes all the packets that reach a given network interface, and displays them in a user-friendly way.
The venerable tool in this domain is tcpdump, available as a standard tool on a wide range of platforms. It allows many kinds of network traffic capture, but the representation of this traffic stays rather obscure. We will therefore not describe it in further detail.
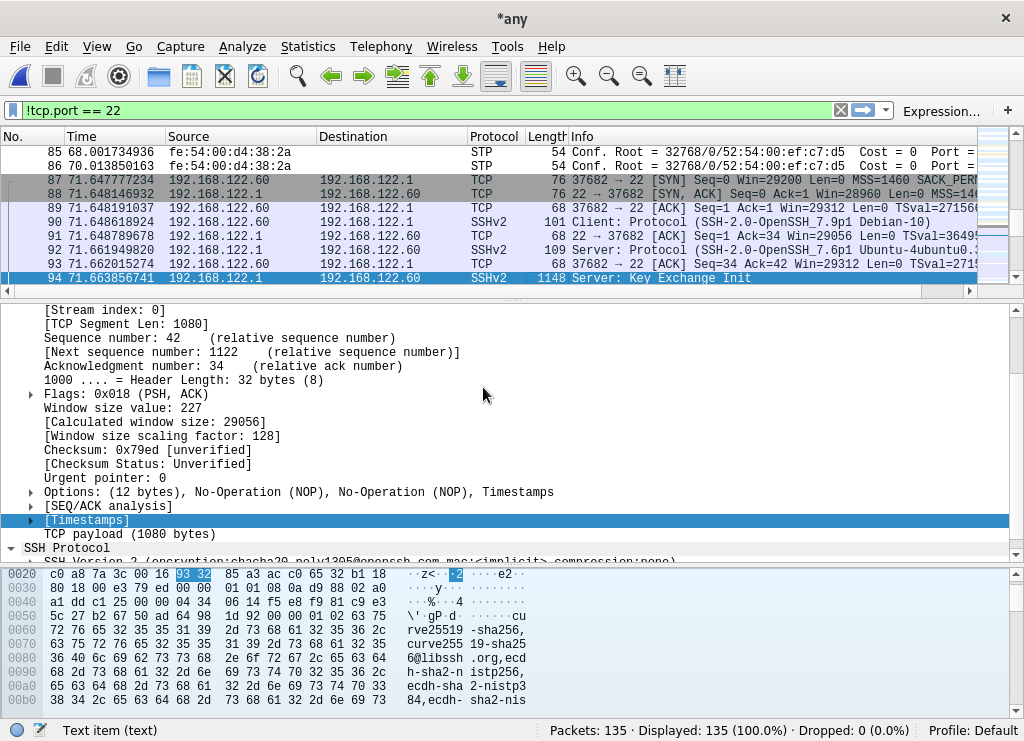
A more recent (and more modern) tool, wireshark (in the wireshark package), has become the new reference in network traffic analysis due to its many decoding modules that allow for a simplified analysis of the captured packets. The packets are displayed graphically with an organization based on the protocol layers. This allows a user to visualize all protocols involved in a packet. For example, given a packet containing an HTTP request, wireshark displays, separately, the information concerning the physical layer, the Ethernet layer, the IP packet information, the TCP connection parameters, and finally the HTTP request itself.
In our example, the packets traveling over SSH are filtered out (with the !tcp.port == 22 filter). The packet currently displayed was developed at the transport layer of the SSHv2 protocol.